Creates automatic plots for wins, ranks, or points for an ff_simulation object as created by ff_simulate().
Arguments
- object
a
ff_simulationobject as created byff_simulate()- type
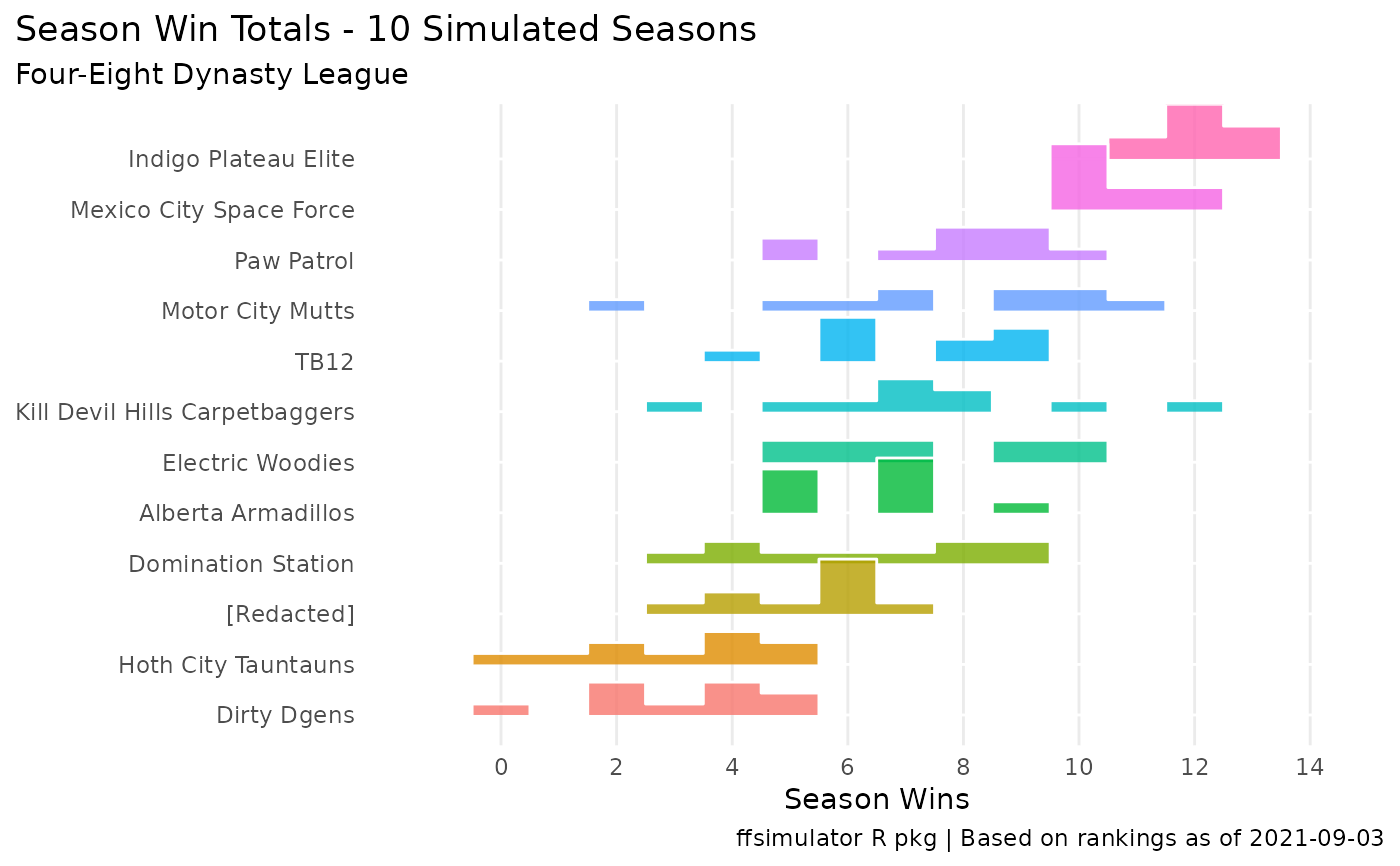
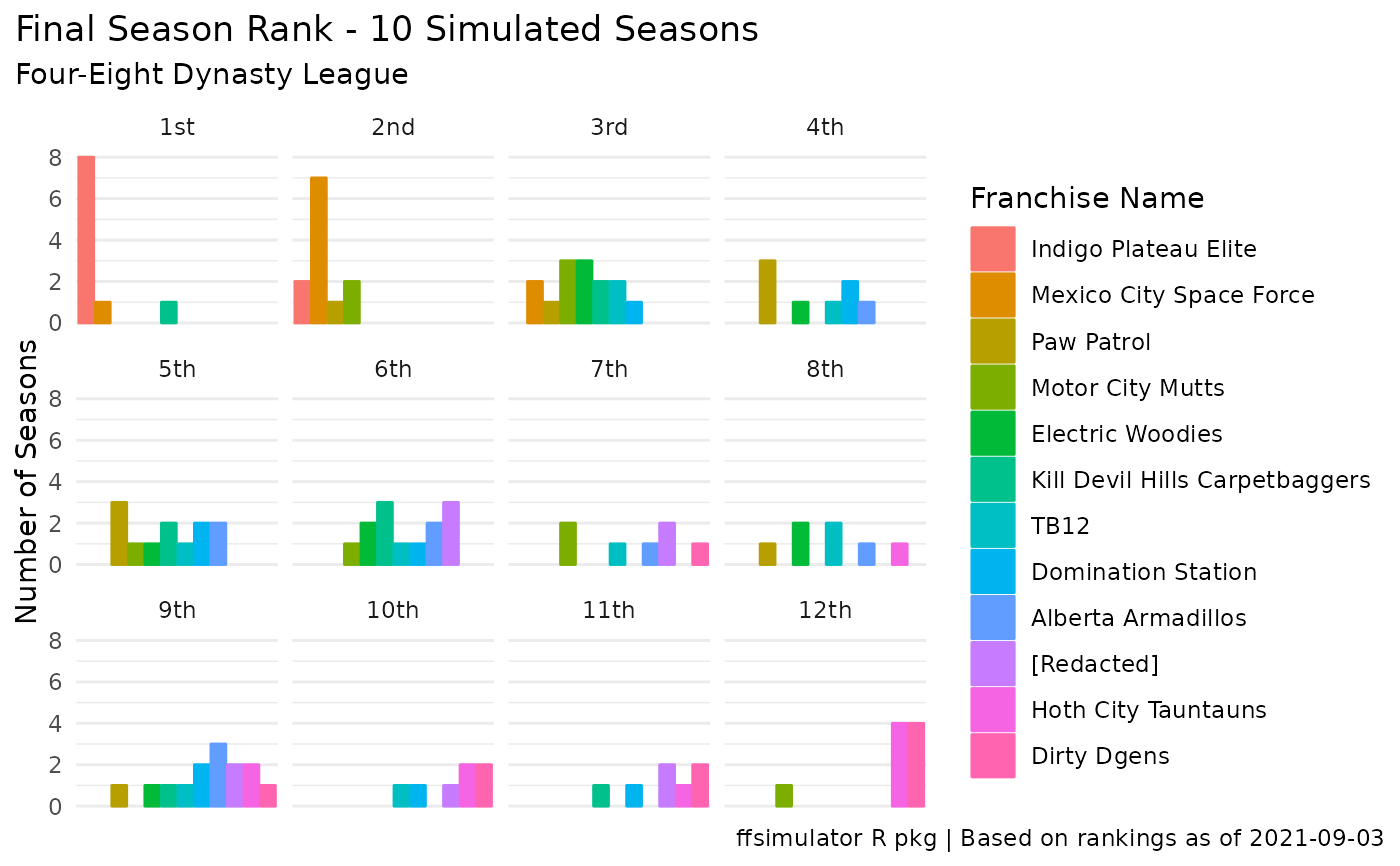
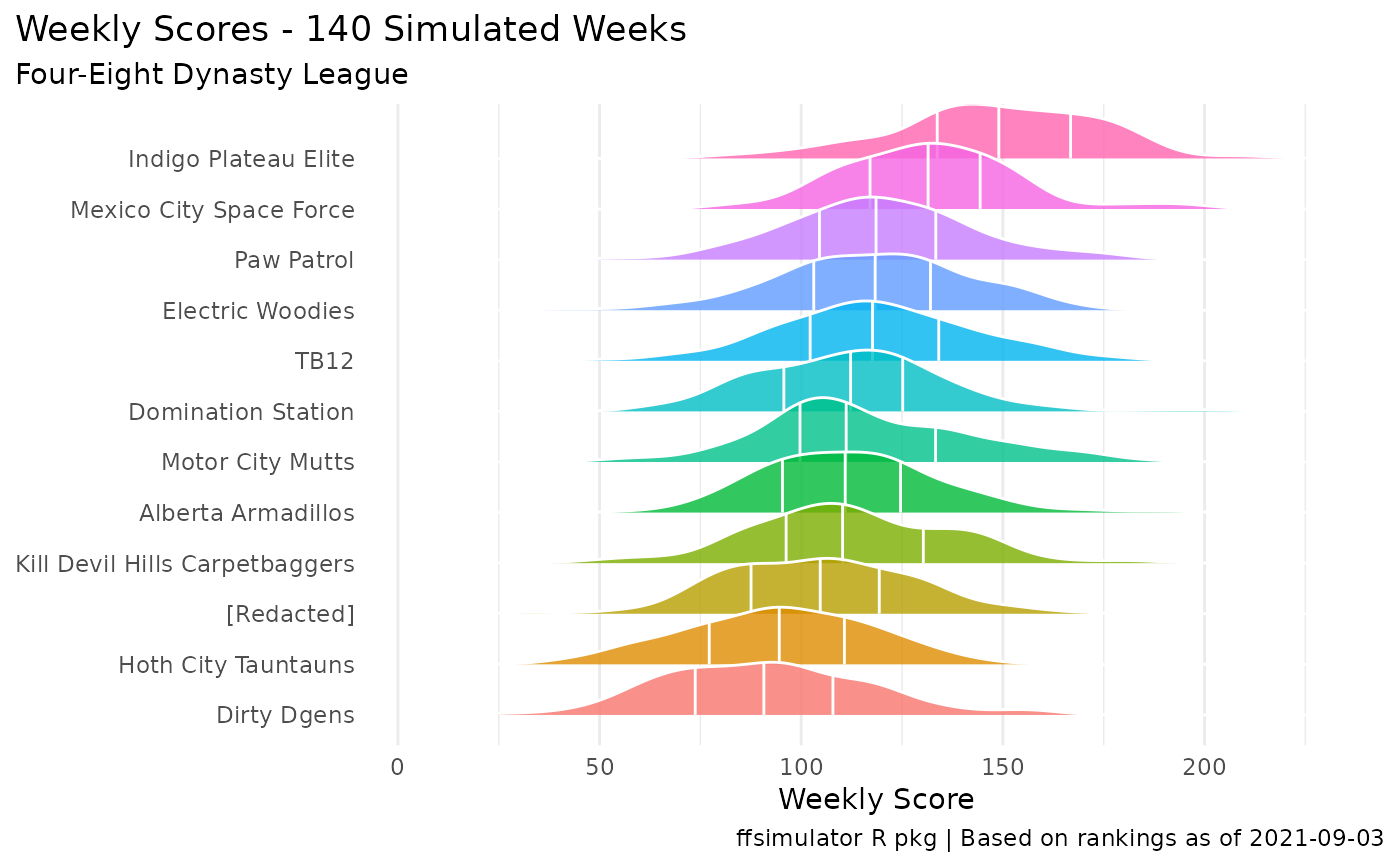
one of "wins", "rank", "points"
- ...
unused, required by autoplot generic
- x
A
ff_simulationobject.- y
Ignored, required for compatibility with the
plot()generic.
Details
Usage of this function/method requires the ggplot2 package and (for wins and points plots) the ggridges package.
See also
vignette("basic") for example usage